
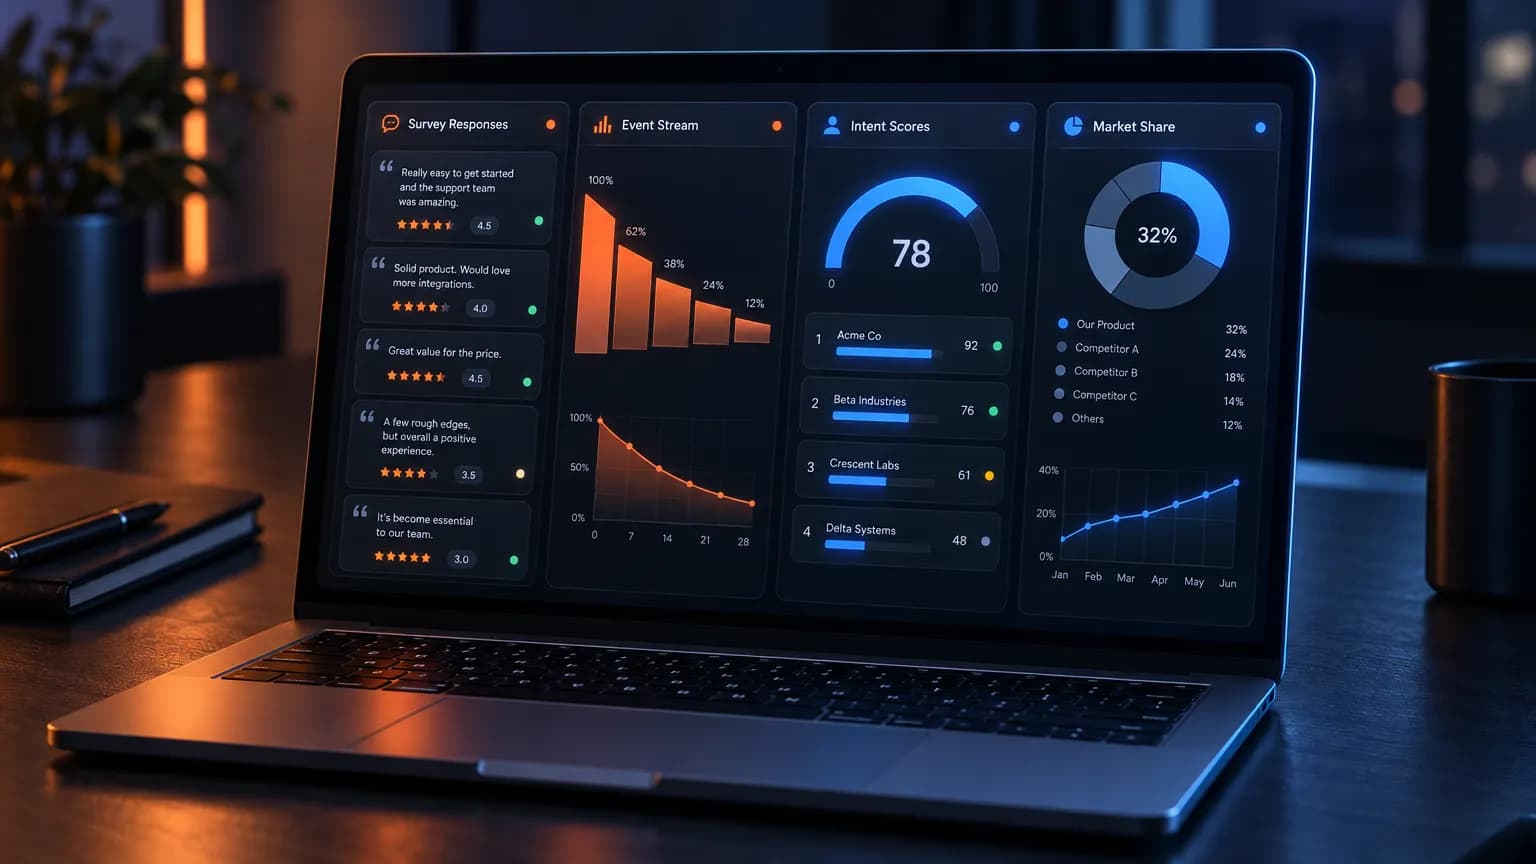
You bought the analytics suite and the intent feed, and the deck says what it said last quarter. What would you have to see on screen to believe you had an insight? Only one of the four kinds of evidence gives you a reason. Which one did you skip?
I read every page on the first screen for this term and wrote down who published it. Eight of the ten results I could identify were published by a company selling software in or near this category. Not one sorted the tools by what they can measure, which is why the lists look interchangeable and the shortlists built from them keep landing on the same four logos.
What the lists cannot tell you is which tool will show you something you did not already believe. Four tools can sit in the same shortlist and still leave that question open, because none of those lists was written to answer it.
After pricing this category on 10 November 2026, I can tell you where the customer insight tools differ, and it is not in the feature list. It is in what each one refuses to tell you.
Where This Article Starts, and What It Hands to Customer Research Tools
Recruiting the right people, paying them, and deciding how much conversation is enough all belong to our guide to customer research tools. That page owns the collection problem. This one starts downstream of it, at the screen, and asks a narrower question: once the data exists, what does this software actually let you see?
The two categories get confused because they share a vocabulary. If you are trying to stand up a program rather than buy a tool, voice of customer research covers how that operates. If you need a picture of a market rather than a sentence out of a buyer, that is a different purchase again, and a different article.
What is left is the tooling question, and it has a shape the lists ignore. Every tool in this category produces one of four kinds of evidence:
- What people say: a sentence a person gave you, plus how often other people said the same thing.
- What people do: an event, a funnel step, a session. Observed, not reported.
- What people intend: a score attached to an account, computed from behavior somewhere else.
- What the market does: a share, a traffic estimate, a category trend.
Four kinds of evidence, four failure modes, almost no overlap in what they prove. Picking customer insight tools comes down to knowing which kind you are missing. What follows is not a ranking: every tool here is decent at its job, and the money gets wasted because nobody says where each one stops.
Four Kinds of Evidence, and How They Sort the Customer Insight Tools Market
Put the four side by side and a pattern appears that no vendor page states plainly. Only the first kind can tell you why. Only the second is immune to what people believe about themselves. The third and fourth describe somebody who is not your customer, and they describe them well. Hold two sentences in your head while you read the rest. Behavioral analytics never tells you why. Intent data never tells you anything about your customers.
Neither sentence is a criticism of the tool. A thermometer does not measure wind either. A team that knows which instrument it holds can combine two and get an answer. A team that does not buys the two that feel most modern.

That gap shows in the numbers. According to a survey run by Market Logic, a knowledge platform vendor, only 60 percent of decisions in product and marketing teams are backed by consumer data, while at least 80 percent could be. It is a vendor publishing its own survey with no methodology attached, so treat it as a direction rather than a fact. The direction matches what any team will admit privately: the software gets bought, and the evidence stays thinner than the invoice.
What People Say: Surveys and Feedback Return the Only Why You Will Get
This is the only category that can return a reason. Somebody types or says a sentence, and that sentence is the answer to a question you could not have inferred from a click.
Qualtrics XM is the enterprise version of that: a survey builder feeding NPS, CSAT and CES dashboards, with crosstabs and text analytics on open ends. The limit is structural. It answers the questions you already wrote, so if the reason your customers leave is a theme you never thought to include, no dashboard polish surfaces it. Pricing is a quote.
Typeform, SurveyMonkey and Alchemer do the collection and the first layer of statistics. Logic branching, a response dashboard, basic significance. What they do not have is a panel, incentive management, or any synthesis across studies. Buy one and you have a form, and a sample of the people who like filling forms in.
User Interviews is the recruitment layer, priced per session: $49 pay as you go, or $41 on an annual commitment, with advanced B2B targeting adding the same again. The participant's incentive is separate. It schedules and manages people, and does not analyze a word of what they say.
Dovetail is where those conversations land: transcripts, tagging, AI summaries, a searchable repository. Its pricing page, checked on 10 November 2026, lists three tiers from $4,800 a year for the platform and up to five users, with credits billed separately at 15 cents each. A repository has no recruiting and no opinion about whether your sample represents anyone, which is why it pairs with the tool above rather than replacing it.
Then there is the feedback you did not commission. Zendesk and Intercom hold conversations from people who were annoyed enough to write in. Useful, cheap, and missing the quiet majority who simply left. If you have ever read a support backlog and concluded that billing is your product's main problem, that is the bias talking.
What People Do: Behavioral Analytics Is Honest and Never Explains Itself
This is the category that cannot be fooled. Nobody misremembers a click. That is the whole value, and the whole limit.
The economics now favor measuring this properly. Contentsquare's 2026 benchmark, built from 99 billion sessions across 6,500 websites, found that the cost of a single visit rose 30 percent over three years, including 9 percent year over year, while traffic fell 4 percent. When a visit costs more, every measurement that explains why it converts is worth more.
Amplitude gives you the event stream, funnels, retention curves, cohorts and session replay. Free covers 2 million events a month. Above that, pricing scales with volume: a third-party reproduction of the vendor's pricing calculator, checked on 7 October 2026, put 20 million monthly events at about $1,575 on monthly billing and $1,260 on annual.
Mixpanel shows funnels, retention, flows and signal detection, with unlimited seats on the free tier of 1 million events. Its published annual tiers run from 1.5 million events at $100 a month to 10 million at $840, with anything above 20 million quoted. Monthly billing runs higher.
Contentsquare, which absorbed Hotjar, shows session replay, heatmaps, zone analysis, funnels and frustration signals. Live pricing on 10 November 2026 is free for 200,000 sessions, Growth from $39 a month on annual billing ($49 at full rate), Pro and Enterprise by quote, plus a separate voice of customer product from $79 a month. FullStory sells replay with full capture and search across sessions on an enterprise quote, which shows the journey and never the cause. Heap captures events automatically, so you can define one retrospectively and still see the history.
GA4 is free and shows sessions, channels and conversions. It is also the tool people mistake for a population count. Consent banners, ad blockers and modeled data mean the number is an estimate with a trend line, never a user-level proof of anything.
All of these share one requirement: the instrumentation has to exist before the question does. Ask on Friday why people abandon the pricing page, and the honest answer is that nobody recorded it. A session replay will show you someone scrolling past the same paragraph four times, and never tell you what they were looking for. If you need the wider picture around these tools, our breakdown of the marketing analytics stack covers how they fit together.
What People Intend: Intent Data Describes Someone Who Is Not Your Customer
Now the category that sounds like it closes the gap and does not. Intent tools observe behavior on other people's properties, then compute a score for an account you might want to sell to.
Bombora Company Surge is the reference product: topic surge scores at the account level, a taxonomy of 20,100 topics as of early 2026, refreshed weekly, priced roughly $25,000 to $100,000 a year. It operates at the account, never the person. A third-party review published this year estimates that at around 81 percent precision, roughly one in five accounts flagged as surging has no real buying intent. That is not Bombora's own number, and it is the figure every intent buyer should ask a vendor to beat.
G2 Buyer Intent shows which companies viewed your profile, compared you against a competitor, or read reviews. Narrower than it sounds: only software buyers, only inside G2, and with no contact resolution, so you need an activation layer before a rep can do anything.
6sense and Demandbase turn all of that into predictive account scores and ABM prioritization. What shows on screen is a ranked list and a recommended action, and what you are looking at is a model, not an observation. Its quality rests on how clean your CRM is.
Google Trends and Keyword Planner describe a market's interest, not a company's. Trends is a normalized index, not a volume. Review mining on G2, Capterra or Reddit gives you a competitor's weak points and a category's vocabulary, from the subset of people who write reviews.
The measurement problem here is public if you look for it. According to Pipeline360, IP-based matching accuracy in intent data runs between 40 and 85 percent depending on methodology, and VPN adoption plus the decay of third-party cookies push it down. I am citing a secondary summary of that figure, not the primary study, so read it as an order of magnitude for error.
Which brings back the sentence from earlier. None of this tells you anything about your customers. It tells you which strangers might become them.

What the Market Does: Market and Competitor Data Never Sees a Person
The fourth kind of evidence describes a category, not a buyer. Similarweb produces traffic estimates, channel mix and audience overlap. Hold onto the word estimate: the numbers are modeled, and on small sites the error is large enough to invert a comparison. Semrush and Ahrefs show search demand, ranking visibility and competitor keywords, and they see only the search channel.
Statista, GWI and Kantar sell syndicated categories, shares and segments, sampled at the category level rather than from your customer base. Crayon and Klue monitor competitor launches, messaging and positioning. All public signal, no view behind a closed door.
The widest and least personal kind of evidence is the one most likely to be mistaken for customer insight, because the charts are beautiful and the sample is enormous. It answers a different question: what is happening out there, not in here. If the market picture is what you need, our market research tools guide covers that purchase. If you need a repeatable way to read competitors, the competitor analysis framework keeps it from becoming a folder of screenshots.
Where this category earns its fee is positioning. A segment you can size is a segment you can choose, and our walkthrough of segmentation, targeting and positioning turns market data into a decision rather than a slide.
The Combination That Produces Insight, and the Two That Never Do
Two pairings do the work, and both include the category that can return a reason.
What people do plus what people say. The behavior tells you where to look and the conversation tells you what it means. No other pairing in the category produces a sentence beginning with "because".
A worked version: your funnel shows a 60 percent drop between the pricing page and the trial form. That is behavior, and it tells you where. You pull the records of people who reached that page and left, invite a few into a conversation, and listen for the sentence they repeat. Several mention that annual-only billing was unclear. Now you have a location and a reason, and the fix is copy, not a redesign.
What people say plus what the market does. The conversation gives you the language, and the market data tells you whether that language is a niche or the category. This is how a positioning claim gets built instead of guessed.
A worked version of that second pair: the interviews keep returning the phrase "we outgrew our spreadsheet". Market data shows how many companies sit in the size band where that sentence makes sense, and whether anyone sells against it. If the band is large and the language unused, you have a positioning claim with a number behind it. If the band is small, you have a niche, and you know not to price for a category.
And then the two that never produce insight, however much they cost.
What people do plus what the market does, presented as a customer insight program, is the most common expensive mistake here. Both halves are honest, both are measured, and neither can tell you why. A team running this pair produces a monthly deck that is accurate, well designed and impossible to act on.
What people intend plus what the market does fails differently. It is entirely about other companies, so it is excellent for deciding who to approach and useless for deciding what to say. Teams that buy only this pair get immaculate targeting and messaging that sounds like everyone else's.
The test I would apply before renewing anything: name the last decision this tool changed, and the sentence it gave you that you did not have before. If the answer is a dashboard, you are paying for confirmation.
Turning a reason into work is its own discipline. It has to survive the trip into a brief, which is what our content strategy template is for, and then into a measurement plan, argued in our guide to marketing measurement.
Where the Insight Becomes Work
The tool is never the deliverable. It produces a finding, the finding becomes a decision, and the decision becomes a brief, a campaign or a fix. Where stacks break is the second step, where whoever holds the finding cannot turn it into work without a week of copying.
That is the gap I built Allable for, and I will be direct about its shape: the agent connects to your analytics and search data, reads what is happening, and writes the brief, article or campaign from it in the same conversation. Plans start at €99 a month after a 7-day trial with a card up front, and there is no free tier.
Frequently Asked Questions
Do I need all four kinds of evidence?
No. You need the two that answer the question in front of you. You can usually run a decision with what people say plus what people do, and add market data only when choosing a segment. Intent data is the one you can postpone, because it describes prospects rather than customers.
Why can behavioral analytics never explain a reason?
Because a click is a fact about an action, and a reason is a fact about a person's thinking. Nothing in an event stream records intent, expectation or disappointment. The tool will tell you a session ended after 40 seconds on the pricing page, down to the millisecond, and it will still have no idea why.
Is intent data worth $25,000 a year?
That depends on how much of your pipeline comes from named accounts you can act on. If you run account-based programs with clean CRM data, a surge score is a useful prioritization input. If your motion is self-serve or inbound, the same money buys a lot of instrumentation and conversations, and those produce reasons rather than rankings.
Can one platform cover all four kinds of evidence?
Not honestly. Suites that claim it are usually market or intent data with a dashboard and an activation layer on top, and the missing part is always the one that returns a reason. The practical answer is two products: one that records behavior and one that records what people said.
Put One Reason in Front of Your Next Decision
Point it at the question you could not answer this week. If it comes back with a reason instead of a dashboard, you will know which of the four kinds of evidence the customer insight tools you already own were never going to give you.


