You screenshot a competitor's best post and the meeting starts twenty minutes later. Is that engagement number about the competitor, or about the tool that reported it? Nobody in the room can answer, and the deck still ships.
Why the Benchmark Is the Least Reliable Number in Social Media Competitor Analysis
Engagement rate is likes plus comments, divided by followers, times 100. That is the definition this article uses, and it is one of at least six in circulation. Swap followers for reach and you measure a different thing: how interesting the post was to the people who saw it, rather than how much of a standing audience reacted. On the same post those two numbers can sit an order of magnitude apart.
Three pages published in 2026 define the rate three ways. Hootsuite, September 22: "Interactions relative to followers or reach." Sprinklr, May 18: "Total interactions relative to audience size." Sprout Social, April 27: "Resonance relative to audience size." One offers a choice and declines to make it. Two name an "audience size" that neither defines. Across the six guides I read in full for this piece, not one writes the formula with a denominator chosen on purpose, so two readers of the same page still get two numbers.
The denominator nobody writes down
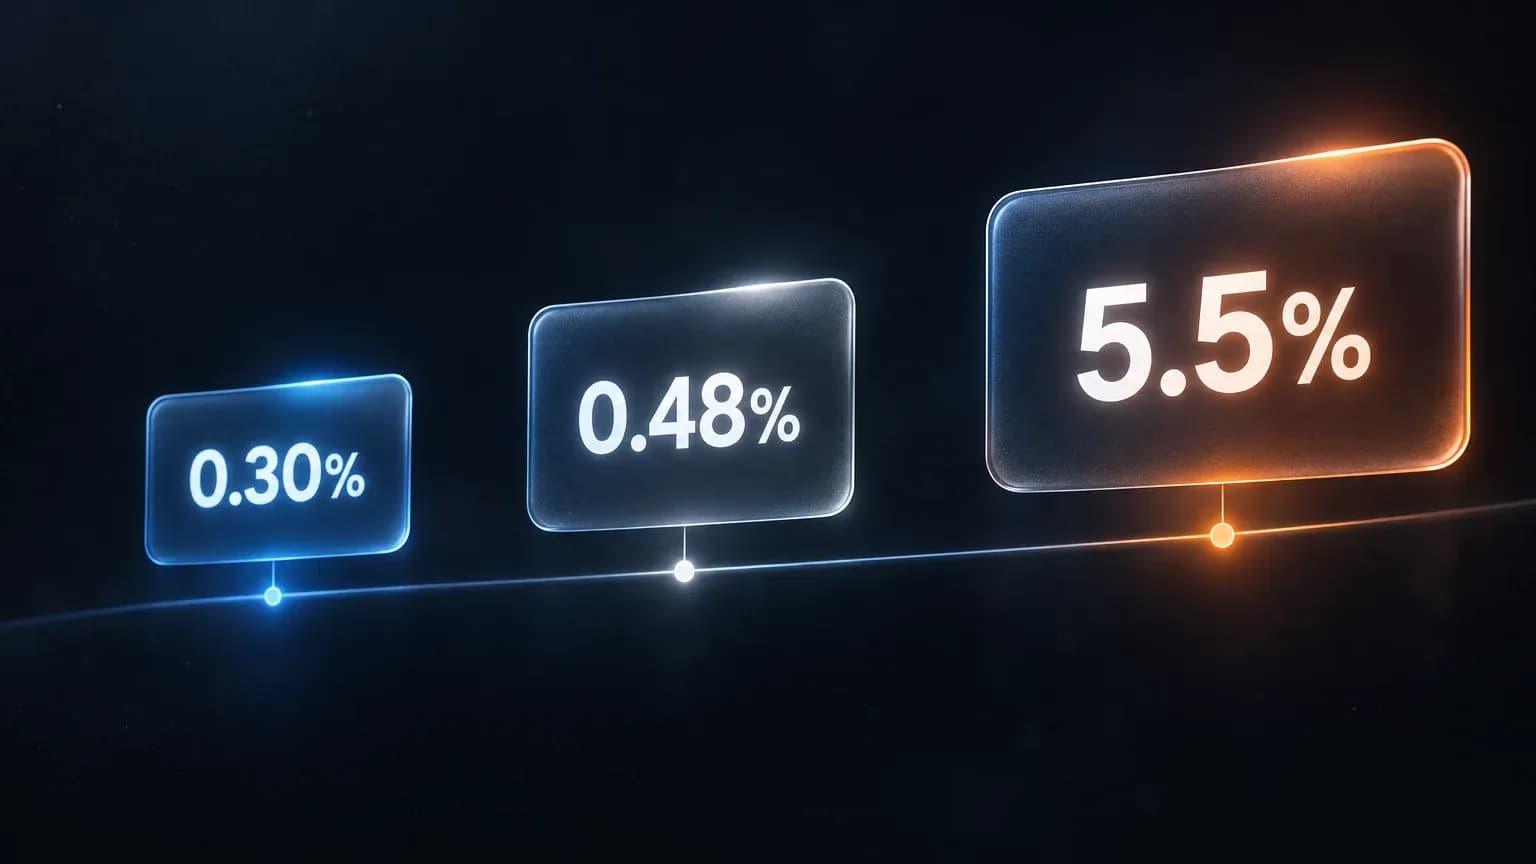
Same platform, same year, three published figures for average Instagram engagement rate: 0.30% from Quid (Rival IQ), 0.48% from Socialinsider, roughly 5.5% from Buffer. More than an 18x spread, and as the aggregator that compared them noted, none of these studies is wrong. Each answers a different question.
Hold the platform and swap only the industry: Rival IQ reports 0.26% for Financial Services on Instagram, Hootsuite reports 3.80% for the same industry. Same platform, same industry, both called correct.
Reach is not public. A competitor-benchmarking vendor's help center states it plainly: "Reach is a private metric and not available publicly. Reach can only be seen by the owner of the profile or others with admin access. This is why we divide the public Interactions by the Followers." Your own account has reach. A competitor's does not. A dashboard showing both in one column is comparing a followers-based rate with a reach-based one, or has downgraded your figure to the weaker denominator.
April 2025 makes it worse. A vendor's help center documents the redefinition, consequence included: "Engagement rate calculations now use Views instead of Impressions" and "Lower engagement rates: With Views as the denominator (instead of Impressions), engagement rates may appear lower." The audience did not change. The posts did not change. One denominator was redefined, so a twelve-month chart that crosses that date is comparing two definitions and looks like a decline.

Whose accounts are in the average
Rival IQ publishes its method, which makes it the safest number here and still not a market average. In its own description: "150 companies at random from each industry in our database of over 200,000 companies." Companies had to be active on Facebook, Instagram and Twitter as of January 2023, with "Facebook fan counts between 25,000 and 1,000,000." The report uses "median performance from the companies selected for each industry."
If you run a 4,000 follower account, that benchmark excludes you by construction. It is a real number about companies that are not your market. Which 150? Nothing in the published method says, and a different aggregator asked the follow-up that matters: Fortune 500 brands or local businesses?
Buffer is the one case where the source describes the sample as a customer base, a median across Buffer users' accounts. For the rest, do not assume a benchmark is a vendor's paying customers; I could not prove it. What is provable: a vendor-selected sample, a size floor, and a composition nobody publishes.
The follower number that cannot fall
A competitor's follower total is a stock. The platforms publish it beside a flow. Meta's help text defines the flow as "Net followers: The number of new followers minus the number of unfollows during this period." Metricool's documentation draws the same line: "Total number of followers at the end of the period selected" sits beside "Growth of followers in the selected period."
Neither definition is a warning, and I am not putting one in Meta's mouth. The point is arithmetic. An account that loses 4,000 followers and gains 4,000 ends the quarter with the same total and an audience that completely turned over. Both are true, and the public number cannot tell them apart.
Two pages get halfway there. Sprout Social warns that "Raw engagement often favors larger accounts." Sprinklr says "Benchmarking is not about tallying likes or follower counts anymore." Right instinct, no mechanism.
What to Read Instead
If the number is this fragile, what survives? Three things a competitor already published without meaning to.
The comment layer is public and nobody aggregates it
Comment text is per post, public, and not aggregated by any benchmark study, because a benchmark cannot normalize it. A vendor's own content page states the case: "Comments are one of the strongest signals of real engagement," adding that comment sections are "full of ideas, objections, and insights from your audience." Treat that as a vendor argument, not research.
A measurement vendor's guide makes the problem concrete: "If three posts each reach 4,000 accounts and most of those accounts are the same followers, true combined reach might be closer to 5,500 than 12,000." Comments share that property. Five verbatim questions under a competitor's launch post are not a rate, cannot be divided, and survive every definition change above.
The one page that names it frames it as gap detection: "If their comment sections reveal frequent customer questions or complaints, you've just uncovered a gap in their service narrative." Good instinct, no method. I found no study that quantifies what comment reading is worth, so I am not inventing one. A structural argument does not need a percentage.

Cadence is an operating decision
Count posts per week. Hootsuite's unit is "Number of posts published per week or month," which turns a total into a rate. A competitor publishing four times as often becomes visible as such. Instead of asking why their engagement is higher, you ask what it would cost to publish at their cadence for a quarter.
Format mix, and the platforms a competitor left
Record format mix as counts, not percentages. Counts let you rebuild the share from parts; averaging percentages across formats produces a wrong number. Then look at the platform a competitor stopped feeding. A brand whose last post on X is dated March is telling you something no benchmark contains.
Choosing the Right Competitor Set
You have two competitor sets and they are rarely the same. One competes for your customers. The other competes for attention and has a much larger audience. Benchmark against the second and you copy formats that do not fit your buyer, then wonder why reach rose and pipeline did not. Start from the buyer, which is the decision the competitor analysis framework is built around.
Hold the set at three. Not because of tool caps, though the caps are real: Sprout Social caps social listening at ten competitor topics, and SocialPilot's roundup records product limits of "up to 10 competitors" and "five brands at a time." Those are ceilings, not targets. Three is the number because you must read the comment layer on every post you record, and that reading does not scale. One guide recommends a smaller set than the caps allow: 24fingers says "Choose 3 to 5 relevant competitors" and "Review their last 30 to 60 days of content."
How do you test whether a competitor belongs in the customer set? Ask whose name came up in the last two lost deals. That list is shorter than the one marketing keeps. If your three are all louder than your buyer's actual alternatives, you built a media diet, not a competitive set.
A Method You Can Run in One Afternoon
No tool needed for the first pass.
- Pick three competitors and one platform. One, because the numerator and denominator change meaning between them.
- Fix the window at 90 days and write both dates down. Later cycles use the same length, or the numbers stop being comparable.
- Count posts per week rather than collecting totals.
- Write the definition before the number. Likes plus comments, divided by followers, times 100, per post, then median across the window.
- Take the top three posts of the window and five from the middle. Record each one's format, topic and URL.
- Record the follower flow, not the total. Gains minus unfollows for the window.
- Read the comments under those eight posts. Five verbatim quotes, tagged, with the post they came from.
Nine fields per competitor per platform.
Field | Unit to record | What it prevents |
|---|---|---|
Engagement rate | One named variant: likes plus comments divided by followers, times 100, per post, then median across the window | Two readers, two numbers, and one viral post moving the quarter |
Observation window | Explicit start and end date, same length every cycle | A window of a different length |
Posts published | Count per week | A total that hides a cadence change |
Median engagement per post | Absolute count first, then the rate | Totals that favor larger accounts |
Format mix | Counts by format, not percentages | A share built from averaged percentages |
Top three posts | URL plus format plus topic | Reading one viral post as a strategy |
Follower flow | Net change over the window, never the total | A running balance presented as a result |
Comment layer | Five verbatim quotes tagged question, objection or complaint | A signal no benchmark contains; paraphrase that kills the wording |
Where the number came from | Tool name plus the definition that tool uses | Next quarter as a fresh guess |
If you want a document rather than a row of cells, competitor research template covers that version. For the cross source cycle, competitive intelligence analysis covers routing a finding to a decision.
Where a Tool Actually Helps, and Where It Does Not
One job a dashboard does better than a spreadsheet: continuity. A tool records whether you ran the cycle, at the same window, on the same competitors, cycle after cycle.
The job it does worse is telling you why. Nothing in a benchmark series reads the comments that explain why a launch post outran a competitor's usual engagement.
In the vendor's own words: "we estimate the number of views for competitors' Instagram profiles." Estimated views next to measured ones.
If you are shopping for social media competitor analysis tools, the ones built for monitoring over time are covered in competitor monitoring tools. For the listening layer, social media monitoring tools covers that market.
Common Mistakes
Benchmarking a competitor whose audience is not yours. The number is real and it describes a different buyer. Check the comment layer for evidence their audience asks your buyer's questions.
Treating one viral post as a strategy. Record the top three of the window, not the top one, and look for the format that repeats.
Reporting follower growth as a competitive result. Net change over a quarter can be zero on an account that replaced half its audience.
FAQ
How do you do a social media competitor analysis?
Pick three competitors and one platform, fix a 90 day window, and record the nine fields above. Read the comment layer last and take it most seriously.
What metrics should I track?
Engagement rate with a written definition, the window, posts per week, median engagement per post, format counts, the top three posts, follower flow, and the source of every number.
How is a social media competitive analysis different from a competitor analysis?
Scope. A competitor analysis covers positioning, pricing and product; the social version covers what a brand published and how its audience answered.
Do I need a paid tool for this?
Not for the first pass. Everything in the nine fields is publicly observable. Buy continuity once the manual cycle has survived two quarters, where consistency becomes the constraint.
Conclusion
The benchmark is the most confident number in social media competitor analysis and the least trustworthy one, for three reasons that have nothing to do with competence: the denominator is chosen rather than given, the sample is somebody else's accounts, and the follower total cannot fall in a way that tells you anything. What survives is what the audience actually wrote.
Run the method once on three competitors. Set a reminder for 90 days and run it again with the same definitions, because a comparison only exists once there are two of them.

Run the Same Cycle Next Quarter
Allable keeps the competitor capture, the nine-field record and the comment quotes in one project, so the second quarter compares against the first instead of rebuilding it. Plans start at EUR 99 per month after a 7-day trial.